Making electricity out of thin air is no easy feat. The wind is a largely changing source of energy. Sometimes it blows, sometimes it doesn’t. The uncertainty of wind is not new. Sometimes it comes from the East, sometimes from the West. Sometimes turbulent, sometimes stable. And wind farms are complex systems, as they actually interact and become part of the same wind: see our wake effects post.
In order to shine some light to this question, at Sereema, we have developed the Windfit Sector Analysis. This new tool (part of the Windfit Analysis solution) dives into what the wind conditions are, and how they affect turbine performance and vibrations. In simpler terms, we answer the question: are my turbines producing more or less due to the particularities of the wind, and, is my turbine's lifetime going to be affected by them?
How do we do that?
- First, relying on the high precision measurements from our Windfit sensors. In particular, we are using our high frequency compass to determine the accurate position of the turbines.
- Secondly, measuring the external conditions impacting the turbine, in terms of wind speed, direction and turbulence intensity with the Windfit ultrasonic anemometer.
- Third, evaluating the impact of both parameters above to the turbine overall vibration behaviour.
- And finally, combining this powerful information together with the turbine SCADA data to maximise the value of both data sets and have a complete view of the turbine performance.
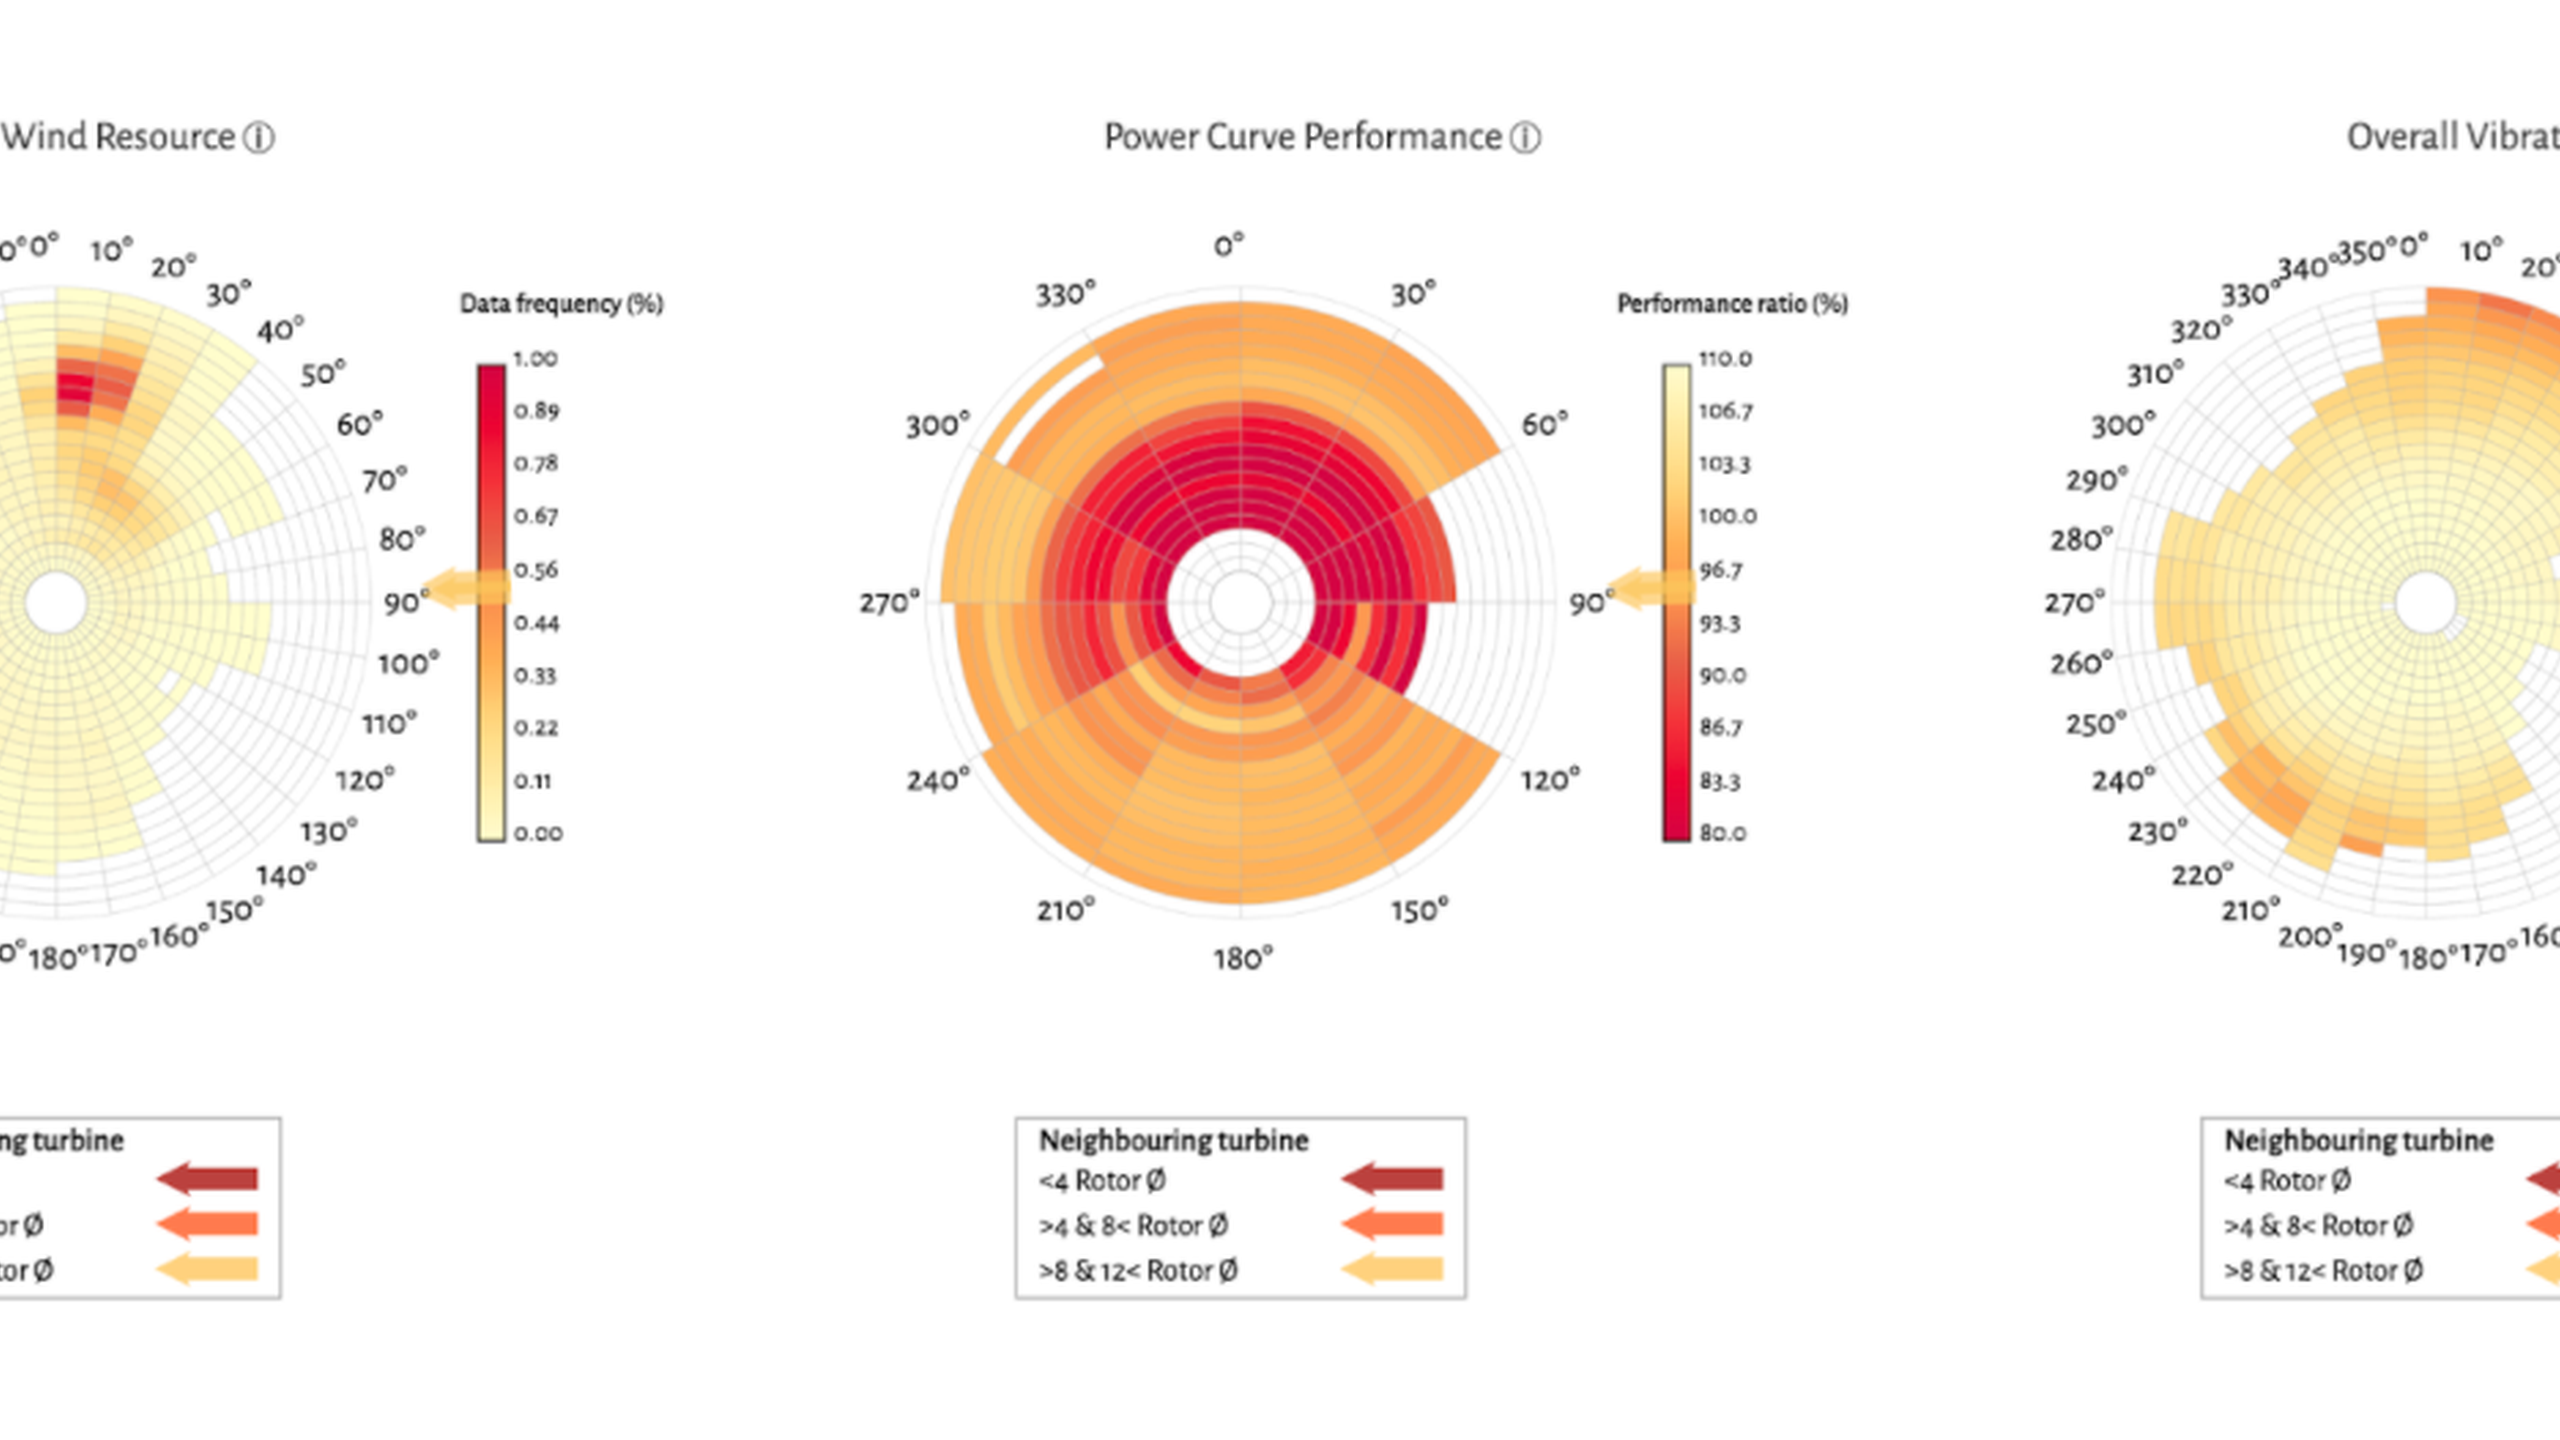
What does it look like? It’s all about the roses.
The level of wind resource, turbulence intensity, power curve performance and vibrations are visualised on circular heatmaps or roses. The colour scale allows one to visualise clearly the severity of a particular measure on a given wind sector and wind speed level. Additionally, further layers of analysis are integrated to study the different results more in detail. Some interesting insights Windfit users have so far found out are: - How highly turbulent winds from some sectors are reducing the turbine power curve performance by more than 5%. - How wake effects from neighbouring turbines lead to higher turbulence, and how this connects low performance or high vibrations at specific wind sectors. - How some turbine models present resonance effects as their level of vibrations increases for all sectors at a specific low wind speed level.
Finally, this tool allows Windfit users to play with time scales. This means that you can compare the current turbine behaviour against its historical behaviour, to evaluate the impact of improvement measures, or improve your understanding of the long term degradation on a particular turbine measure.
Check out our full new stack of tools that comprise Windfit Analysis.