We designed the AEP calculator, a tool that finally shows you a path to combine complex information from multiple datasets to precisely estimate the change in performance on a turbine.
The AEP Calculator, the go-to tool to identify and quantify changes on turbine performance
Changes in performance coming from different events, such as corrections (previously diagnosed by Windfit), like a yaw misalignment or rotor imbalance, a parameter change on the controller, or a turbine upgrade (both hardware and software), occur very often, but the industry does not have the right tools to quantify the performance improvements that can be attained by these corrections.
With the release of this new tool, at Sereema we are jumping straight into the core of the turbine upgrade market.
The million dollar question
How do we do it? The industry’s best in class brings together all data available within Windfit:
- All wind speed measurements are air density corrected using our atmospheric sensors
- Machine learning based PC filtering using wind turbine information to remove all external events, such as turbine stops, grid curtailments or sound management
- Nacelle direction provided by our high frequency 3D compass
- Independent wind speed measurements to verify changes the wind turbine SCADA wind speed (like an nacelle transfer function change)
- Power to power comparison between neighbouring turbines (with high precision thanks to correct North direction and filtering of common free flow sectors).
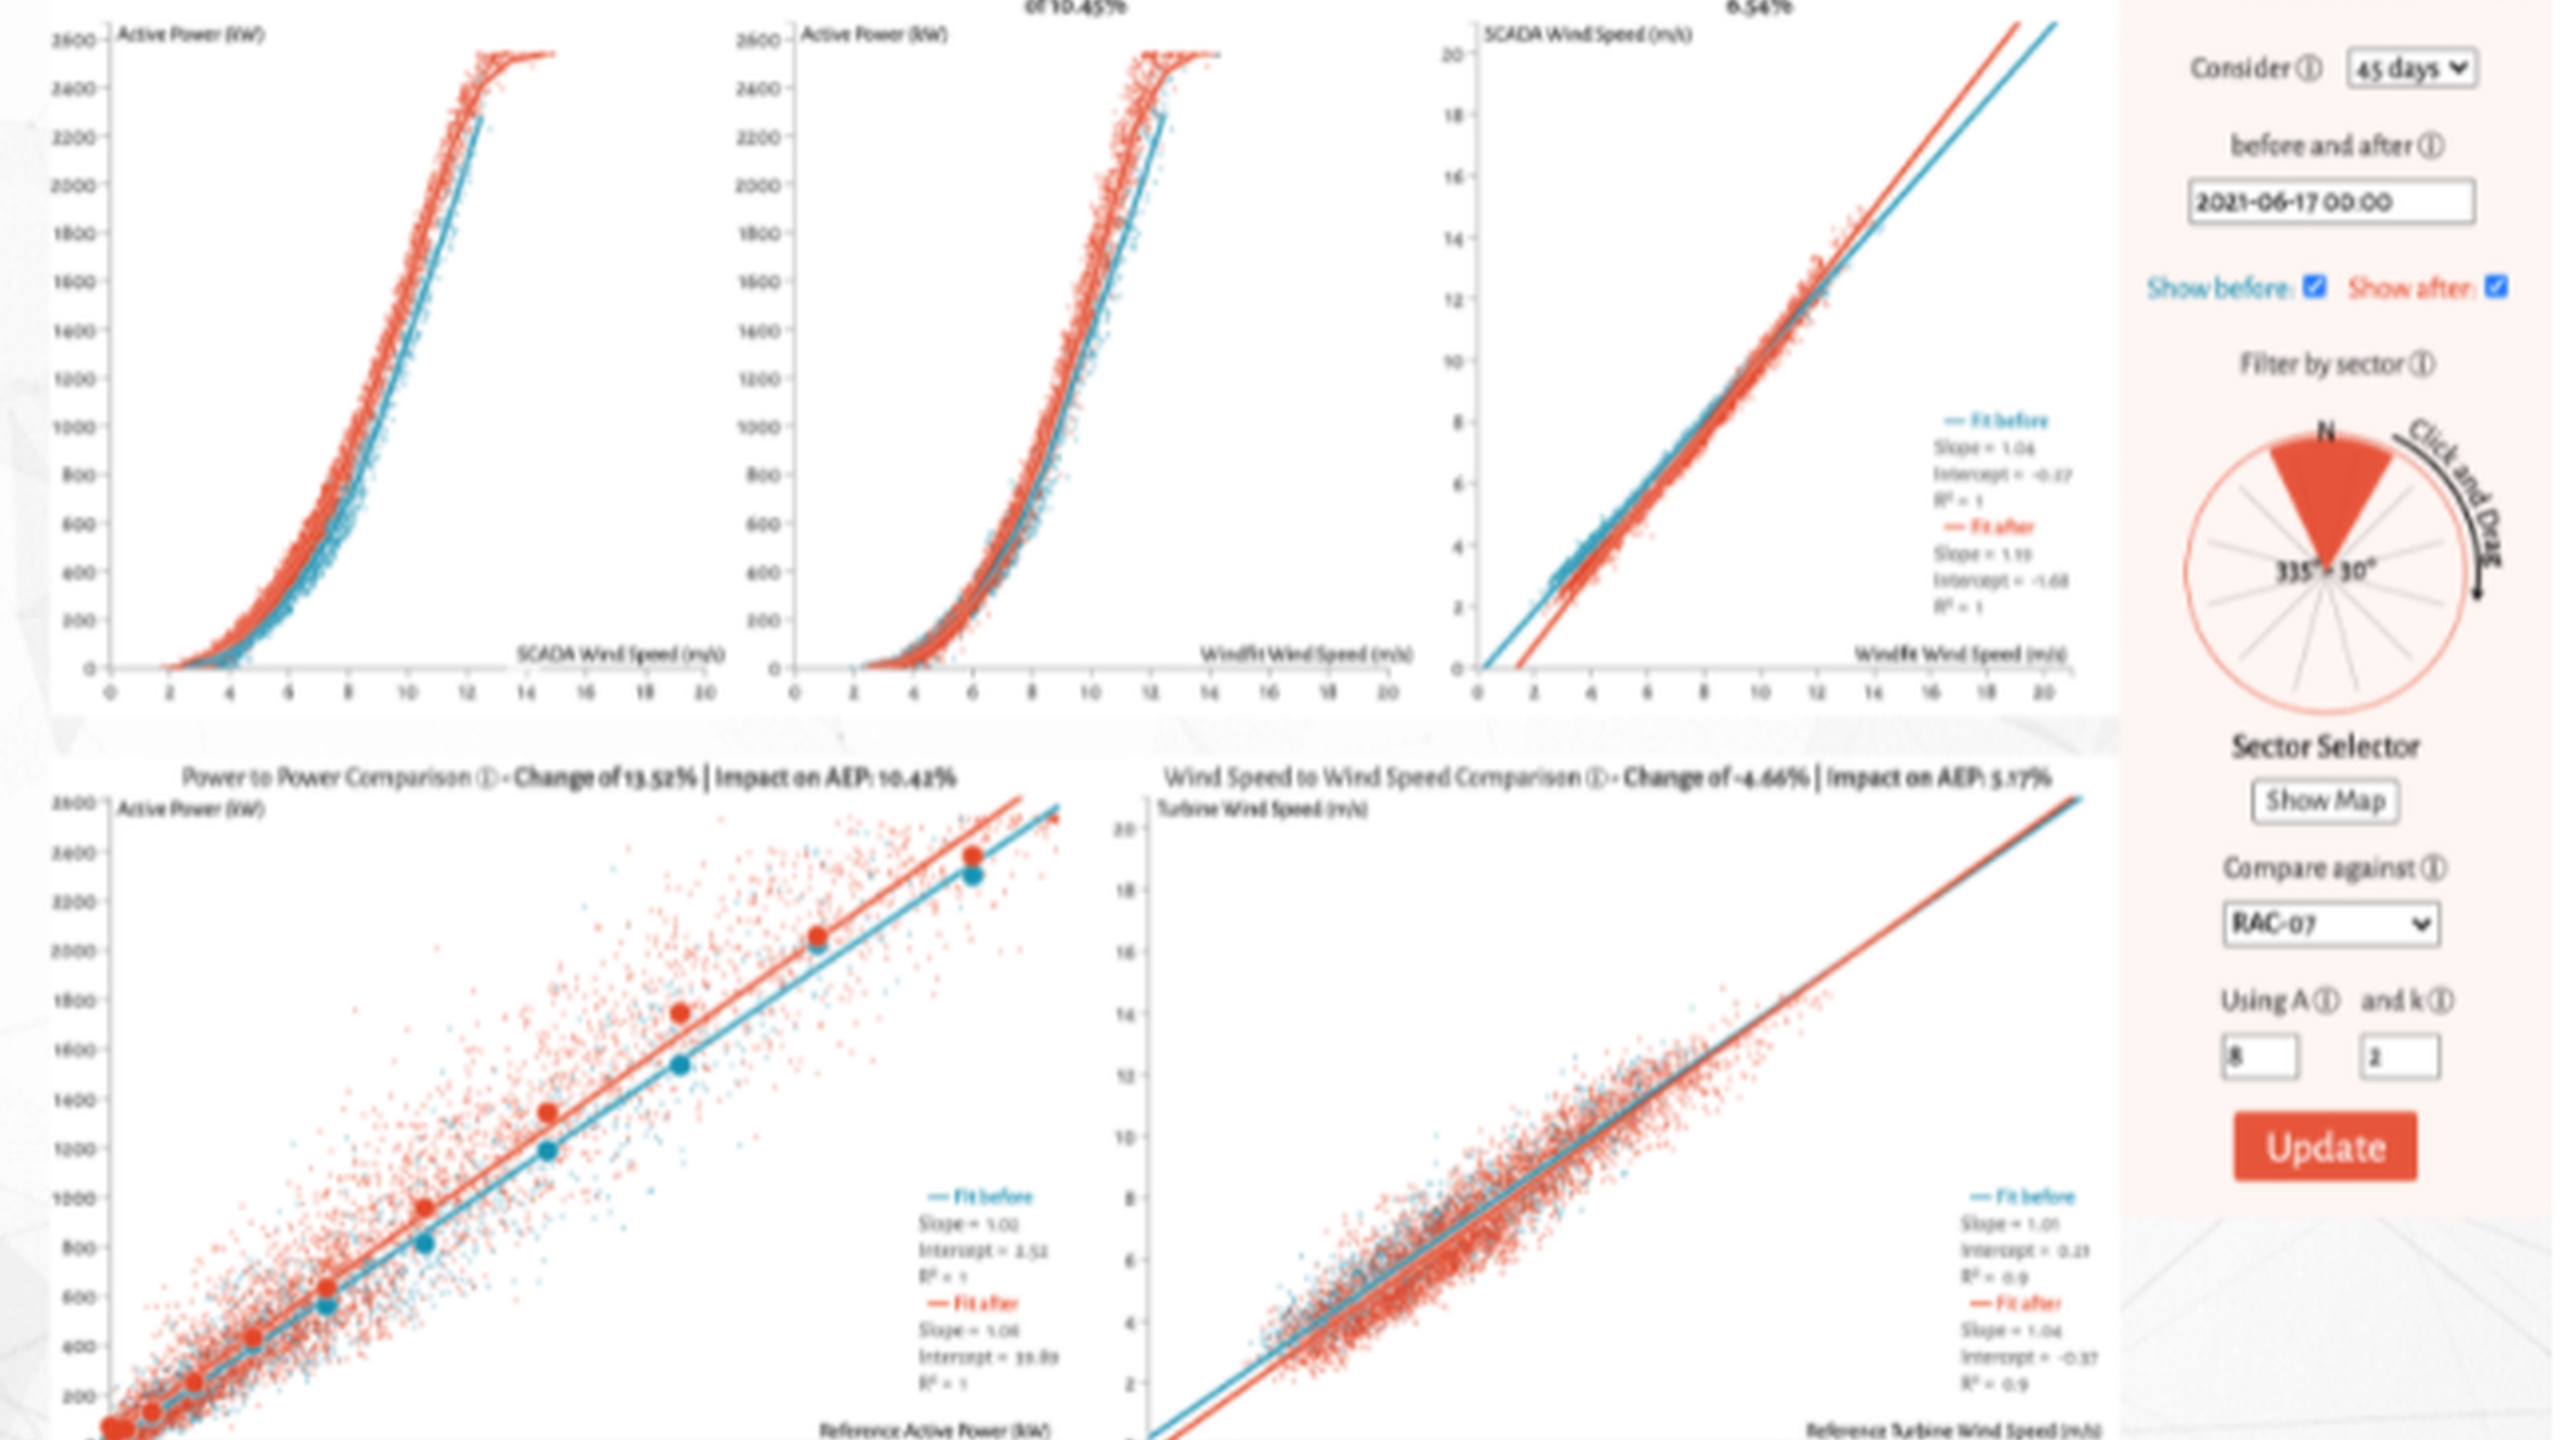
This means we can, for example, quantify the change of performance after the installation of blade aerodynamic improvements like vortex generators, (that will significantly affect the wind speed readings of the turbine), or changes on the wind turbine nacelle transfer function, that lead to a visual improvement to the turbine PC without a real gain in performance. All these, on a very flexible and easy to use tool, allowing you to select different periods of time or sectors of interest.
A 10% AEP gain is calculated, even though SCADA suggested a 21% due to an overestimation of wind speeds from the turbine anemometer.
Windfit Analysis comes as a complement to the existing stack of solutions: Windfit Diagnosis which provides an independent, fast, and unique understanding of wind turbine performance key parameters using high frequency data analytics. Combining it with the most sophisticated tool to identify and quantify the change in turbine performance, Windfit is setting itself apart from the industry in order to support this booming market.
This means that Windfit is not only seeing the changes to the turbine operational parameters (e.g. different yaw reactivity, different pitch strategy, change on turbine anemometer nacelle transfer function, etc.) through our Diagnosis features, but that it can actually support asset owners and operators to precisely estimate the impact of such changes on the turbine performance.
At Sereema we are excited to bring you up this new tool, that together with the Sector Analysis and our Data Studio are going to change the way owners and operators can get the best in class insights from their wind farm.