Windfit Data Studio, the tool that will answer all your questions:
Complementing our two other Windfit Analysis features (see articles here and here), today is time to introduce you to our brand-new Windfit Data Studio.
How it works
Our new Windfit Data Studio allows users to pull information from all data sources within Windfit. This means that users can study and compare different data sets, in different visual formats, and all in one single user-friendly dashboard. The data sources available are: The Windfit sensors data, giving the option to choose between high frequency data or 10 minute resolution data. The Windfit diagnosis data, namely the results from all the different Windfit diagnoses, again at different resolution options. The SCADA data coming from the turbines.
Tackling two important trends
This new tool answers two important digitalisation trends that we believe the wind industry should be working towards: accessibility of data by wind farm owners, and standardization of different data sources in one single platform. In terms of accessibility, the Windfit Data Studio is allowing users to tap into our different databases and access to multiple datasets, including Windfit’s that were not available previously, such as our high frequency data, or some of the high resolution diagnoses. We believe this aspect to be key in understanding the way in which wind farm performance and operation monitoring is done today. Secondly, being able to consolidate all the different datasets in one single platform has a massive potential when it comes to really understanding the behaviour of wind farms. This means Windfit can be used as a watchdog when SCADA systems fail or are not reliable enough. Both aspects, accessibility and consolidation, are empowering Windfit users with the right tool to efficiently manage and operate their wind farms.
How does it look
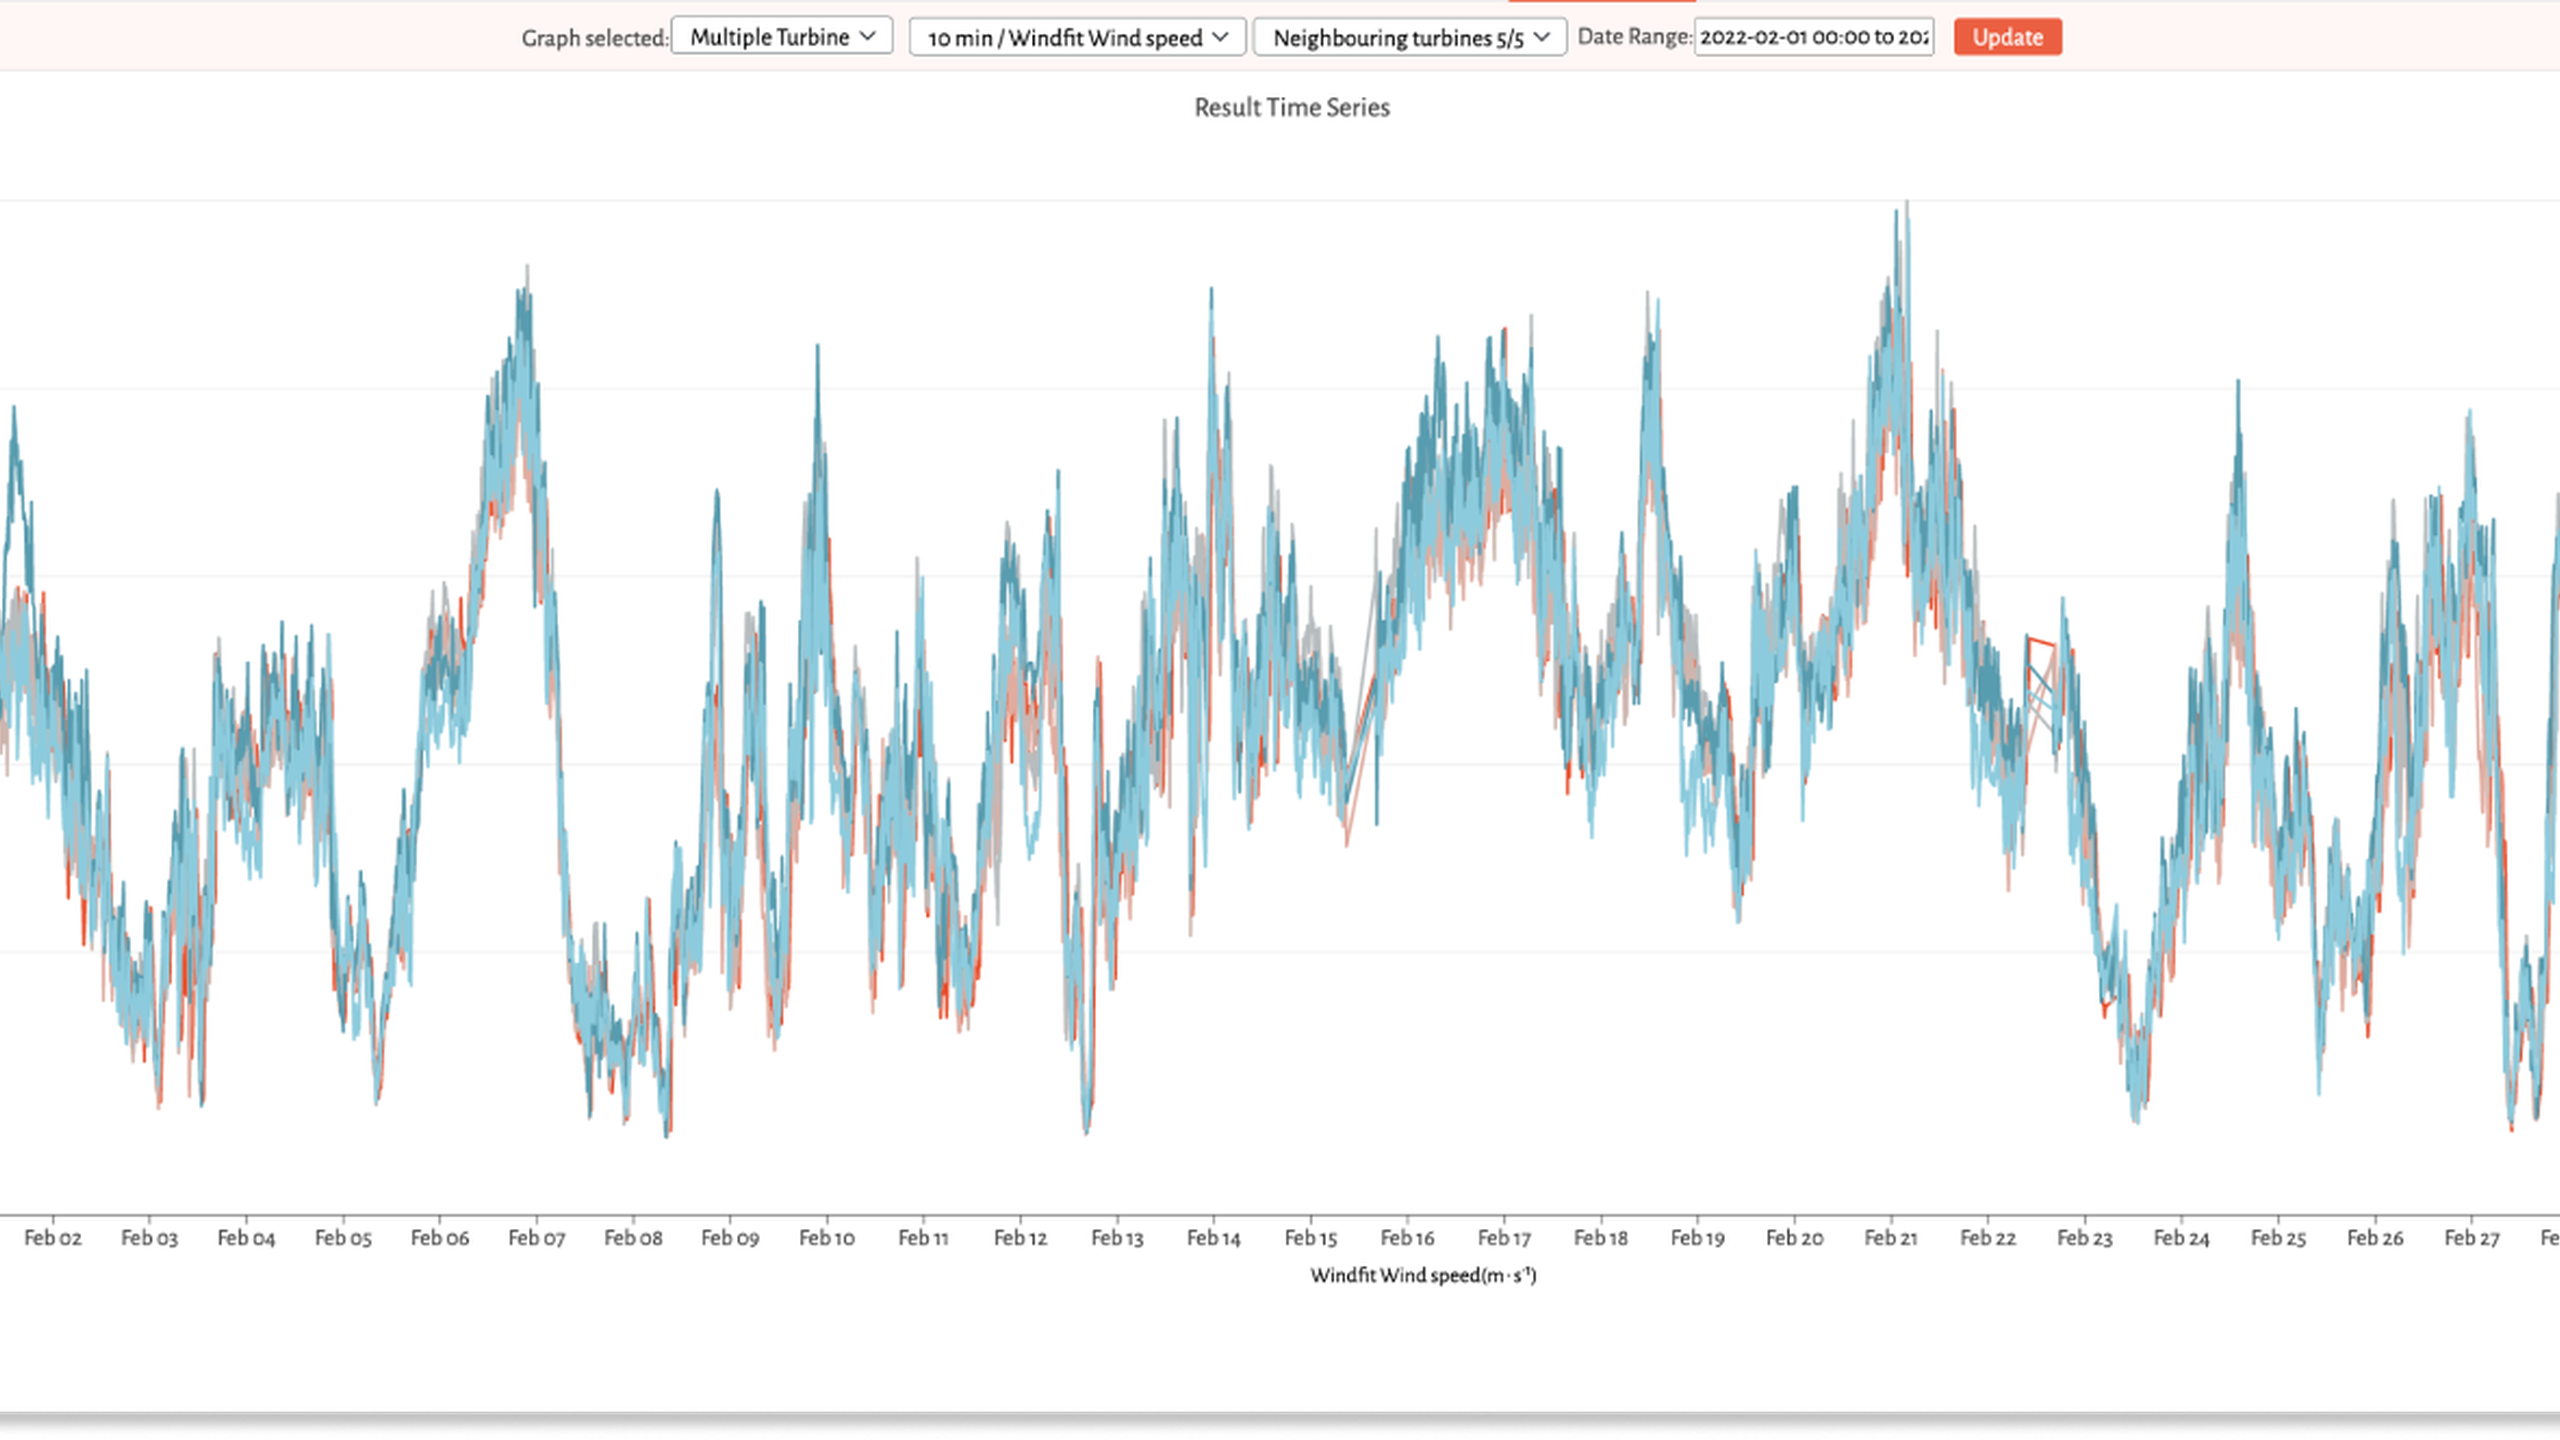
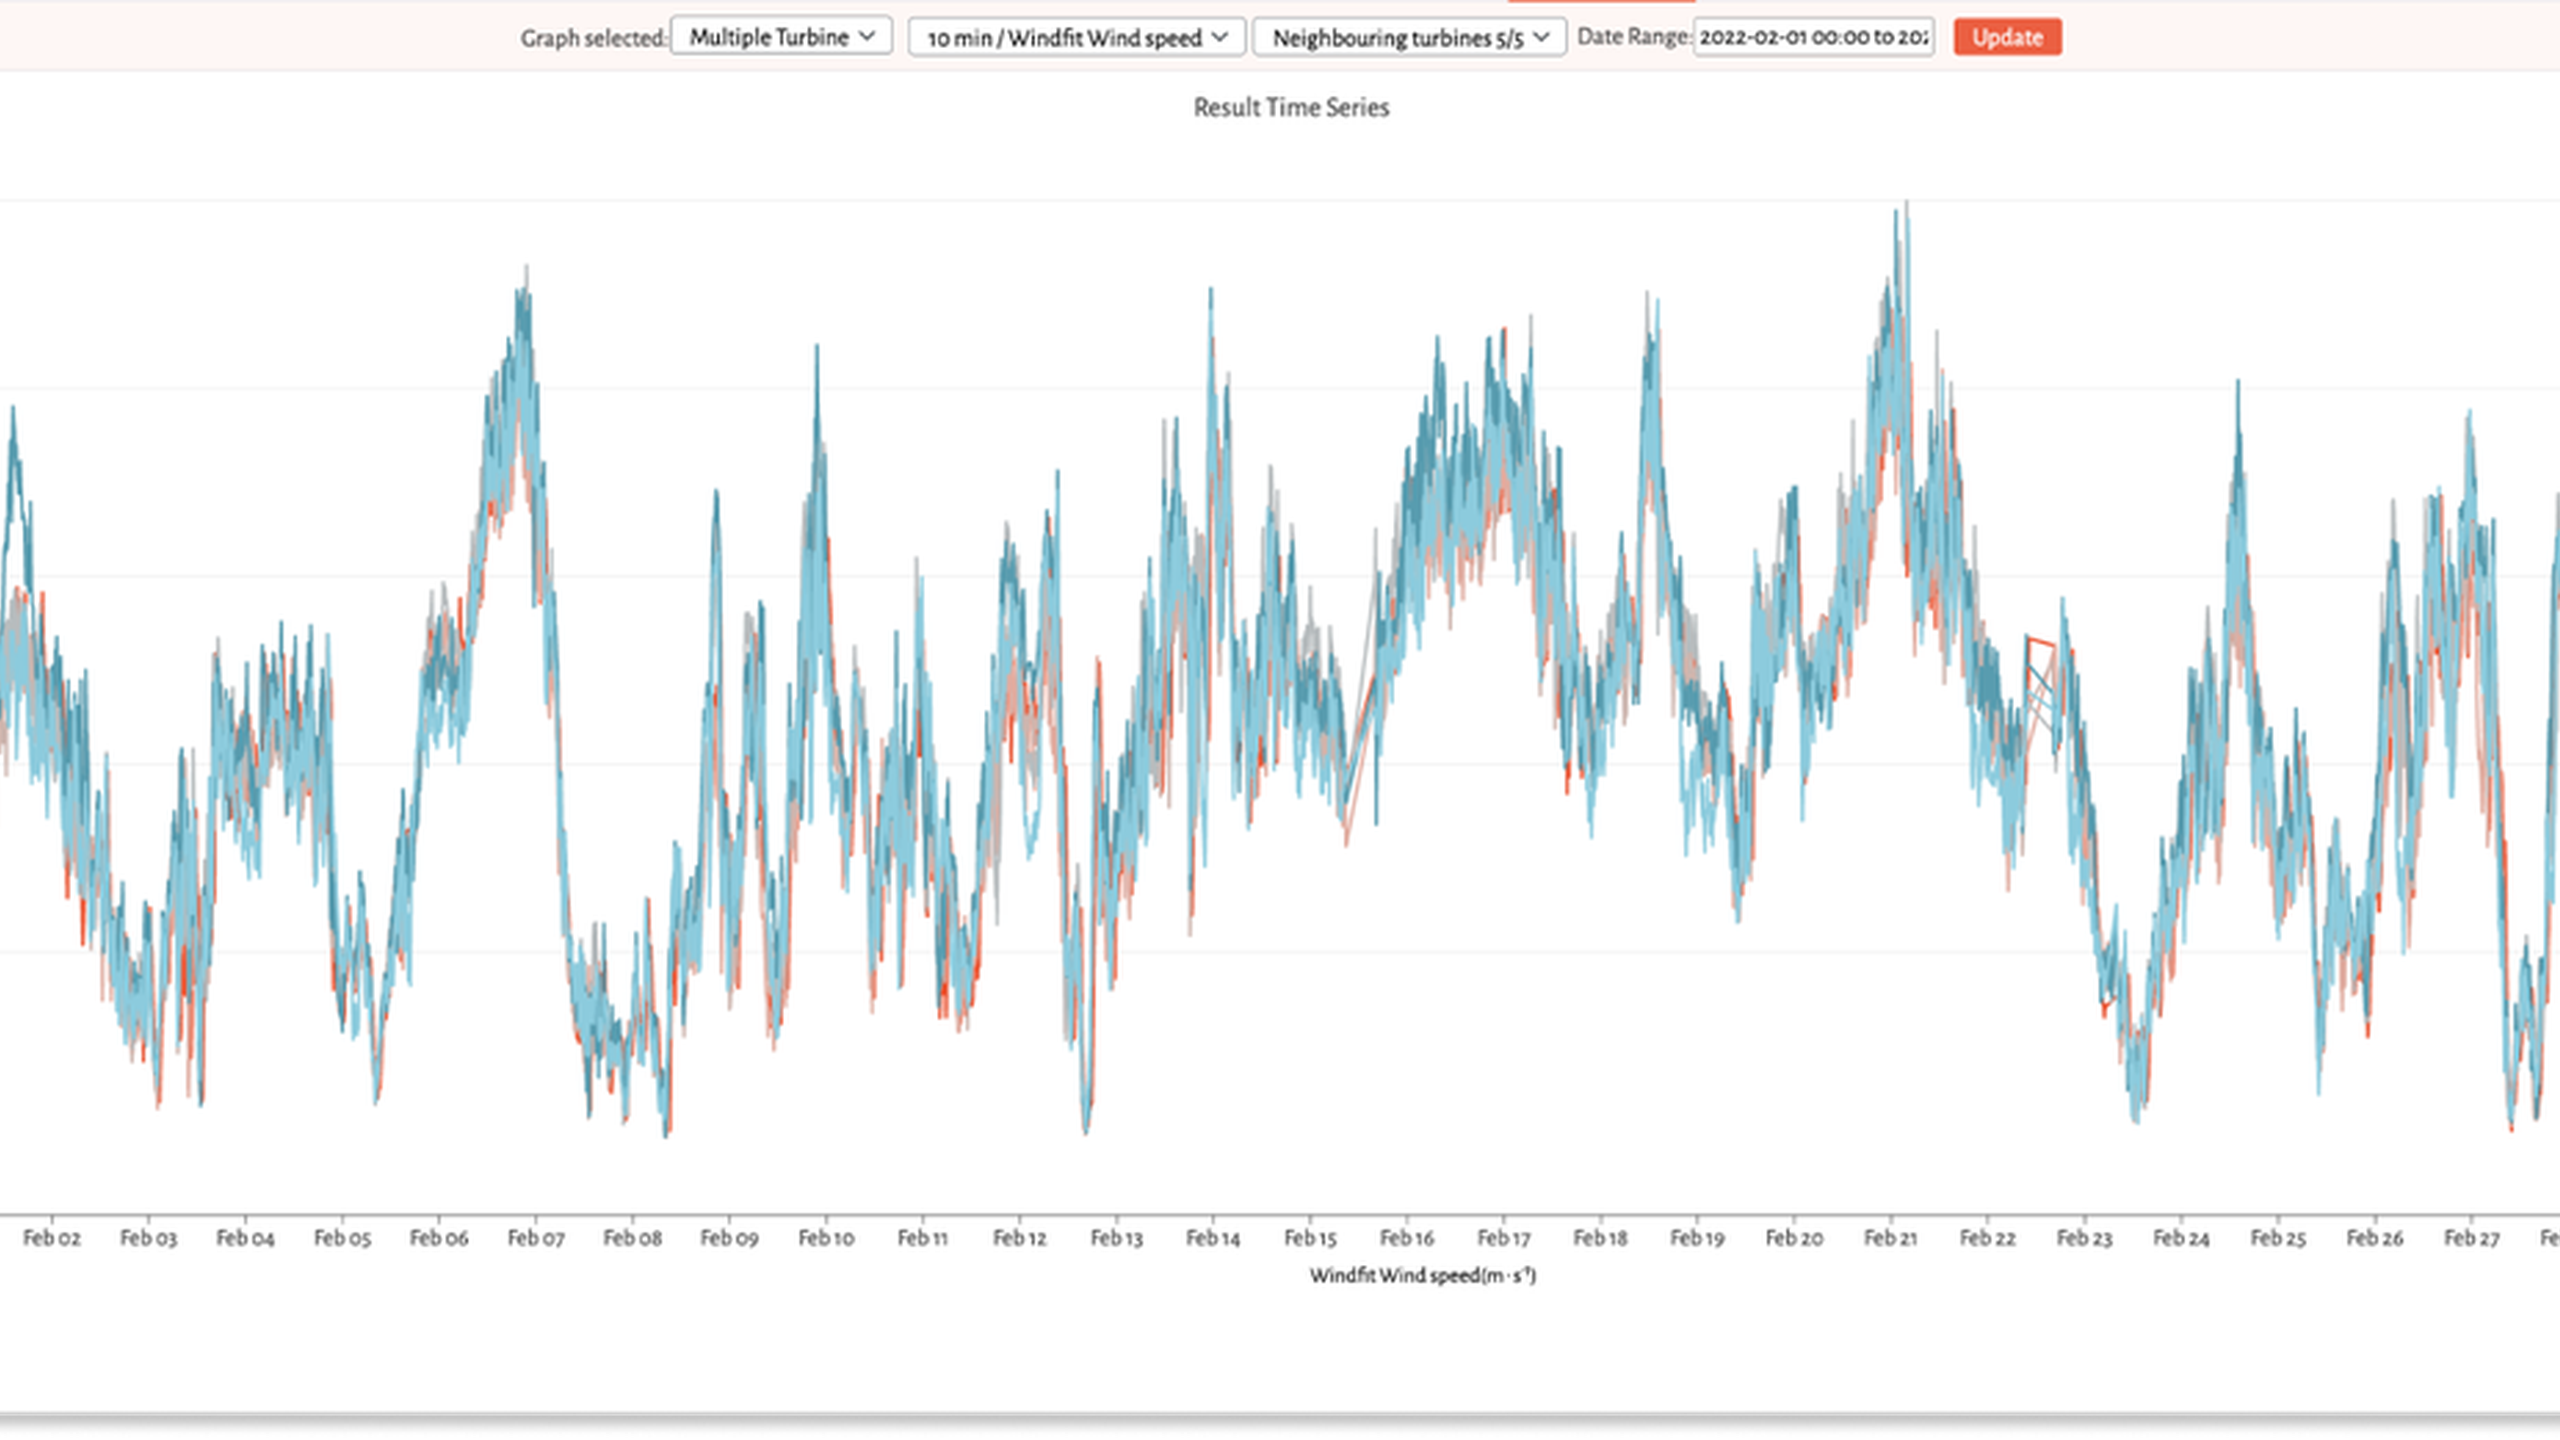
Starting as a blank sheet of paper, the Windfit Data Studio allows users to choose between different graph options. Pick up the different data values you want to show, define a time period, and voilà!
Compare behaviour of different turbines across a wind farm. In this case some wind speed differences are observed for one turbine against the rest of the farm.
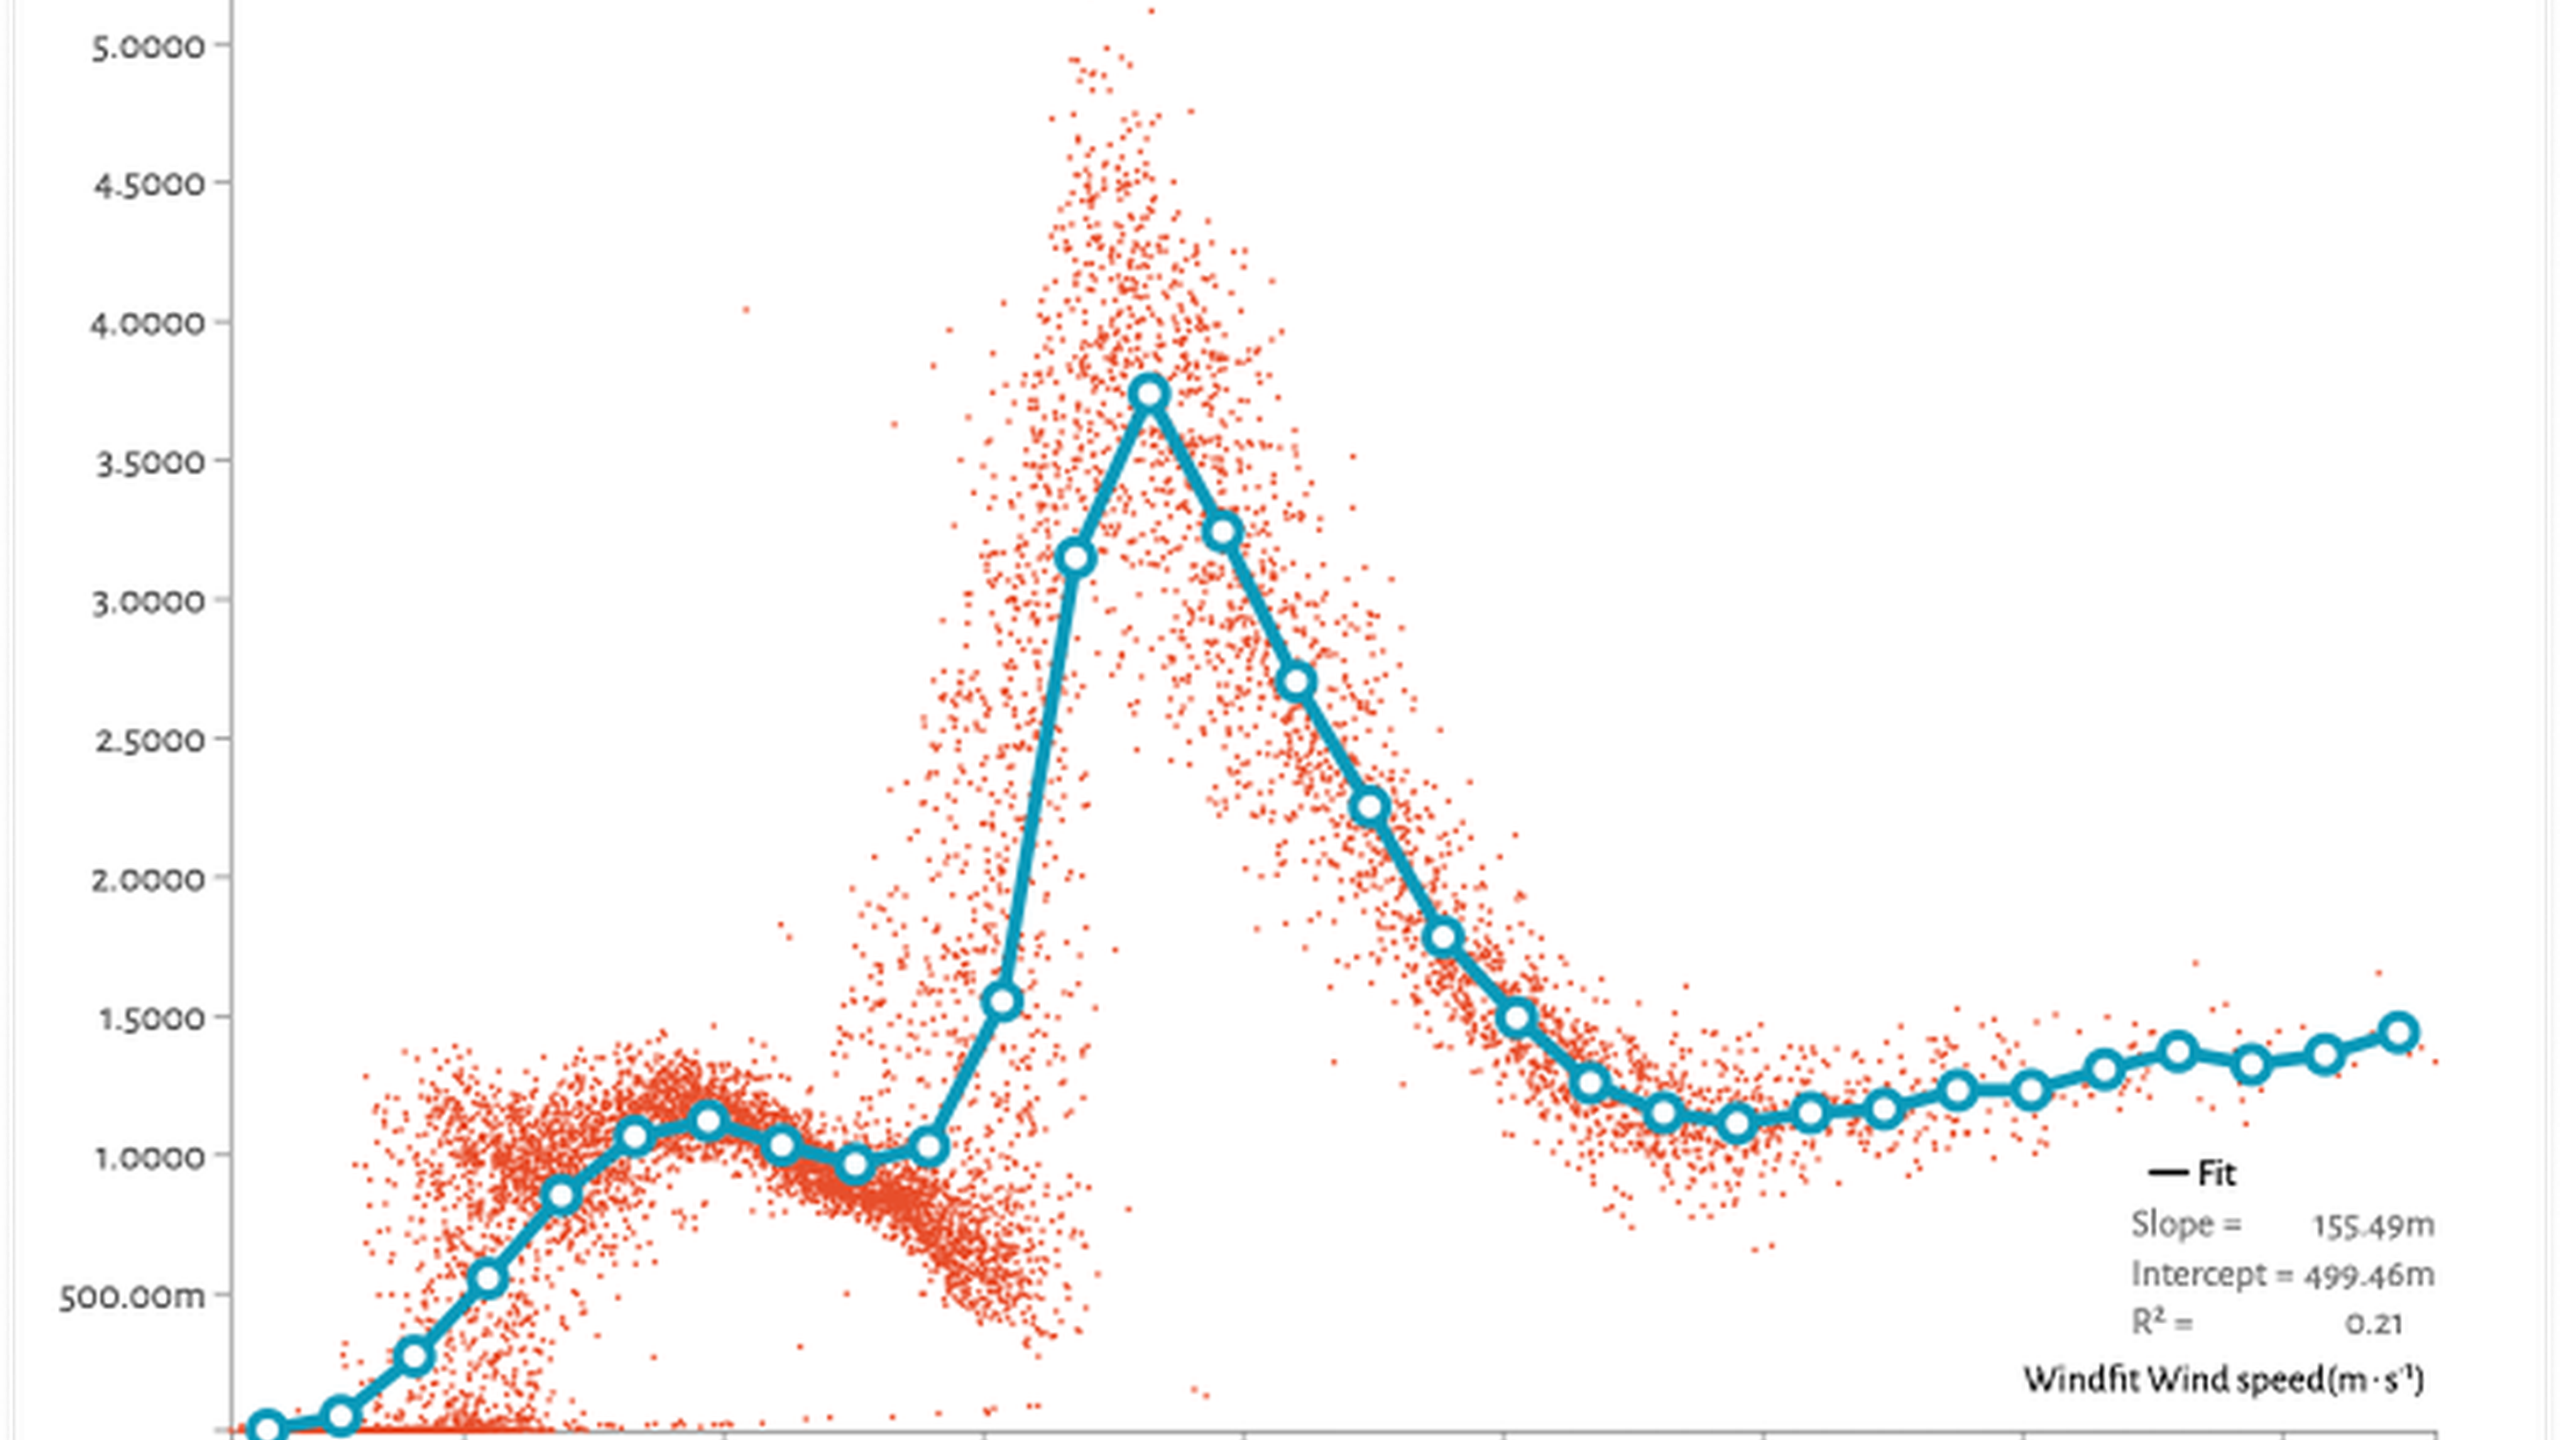
Understand operational parameters of turbines. Some resonance effects are detected on this turbine for a particular wind speed. In practice, the Data Studio allows users to:
- Compare behaviour of different turbines across a wind farm
- Compare Windfit and SCADA data
- Understand operational behaviour of the turbines
- Find correlations between multiple sources of data
Final thoughts
In the previous articles of these series, we showed you our new AEP Calculator and Windfit Sector Analysis. Both answer very important questions for wind farm owners and operators: how is the performance of my wind turbines evolving, and how are my wind turbines operating when compared to each location's external conditions. With the Windfit Data Studio, however, the questions are unlimited, they are just waiting for you to ask them!